Artefact
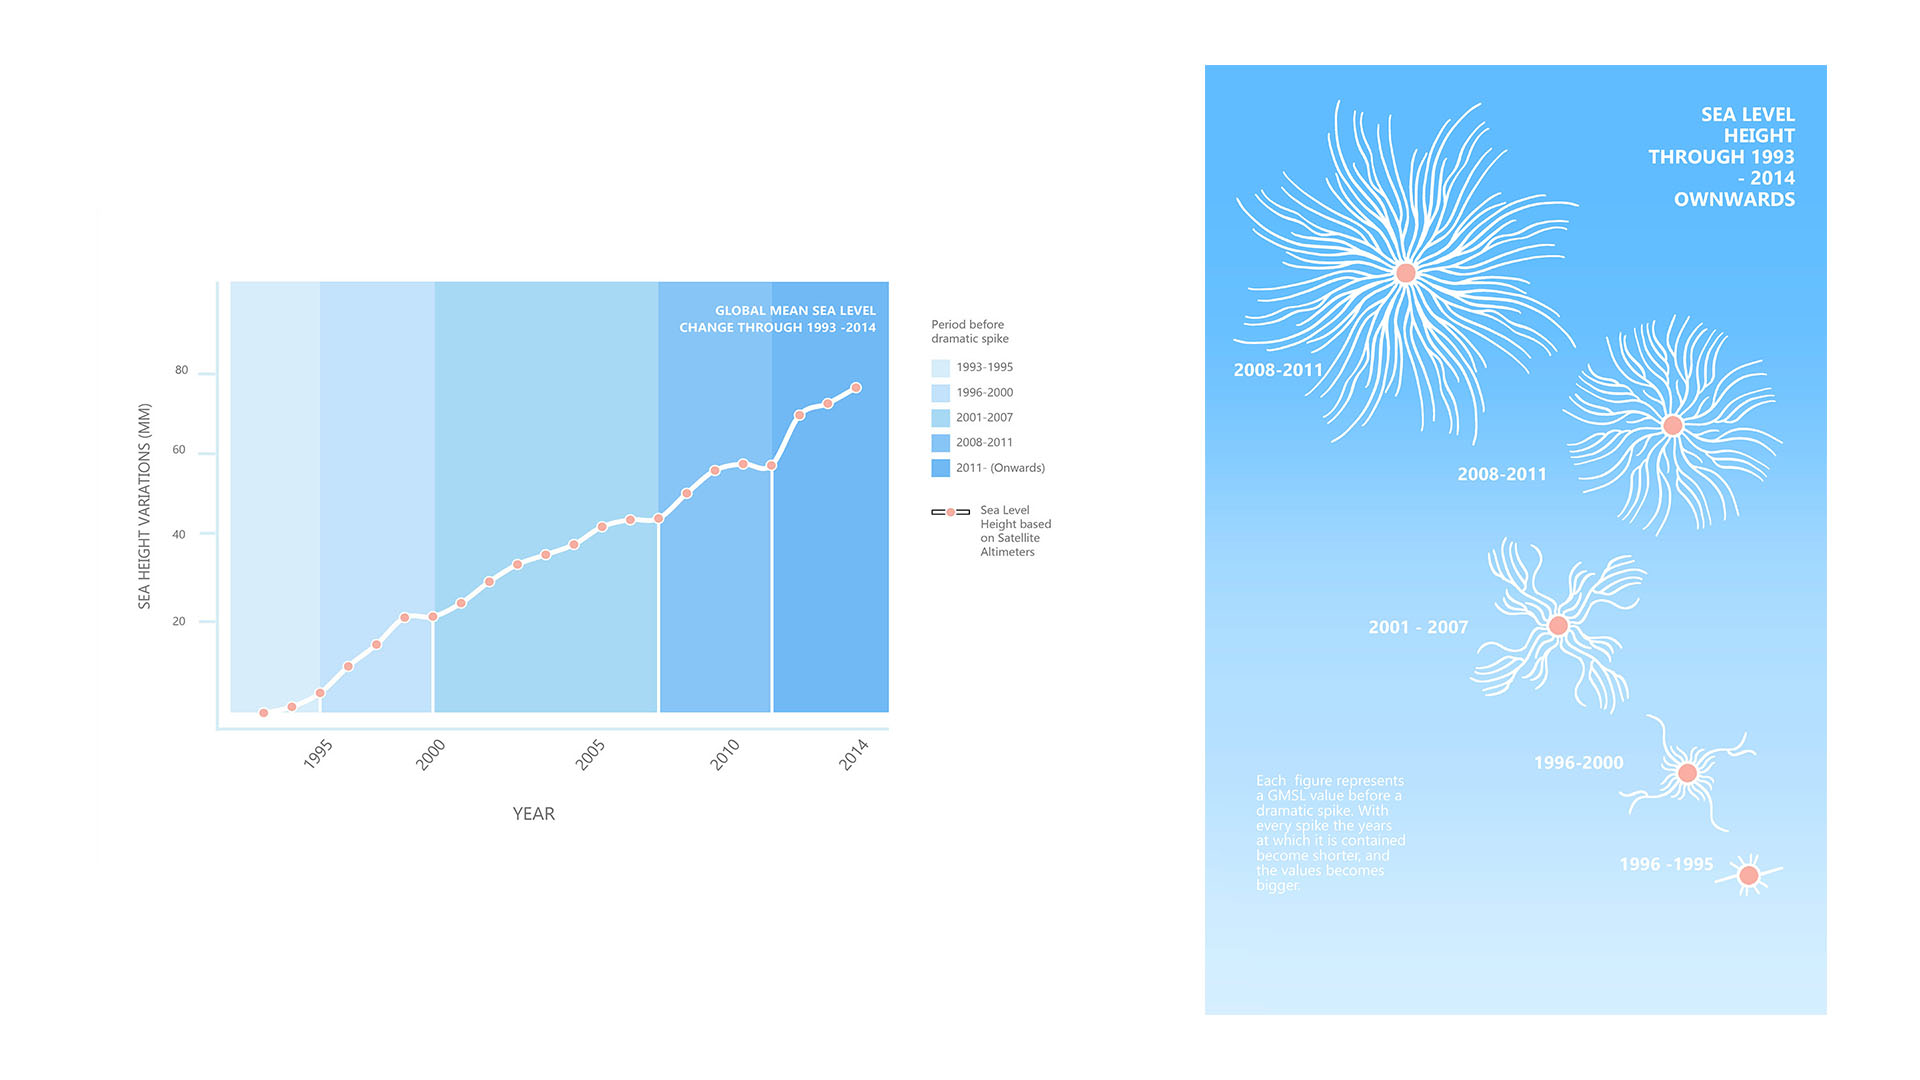
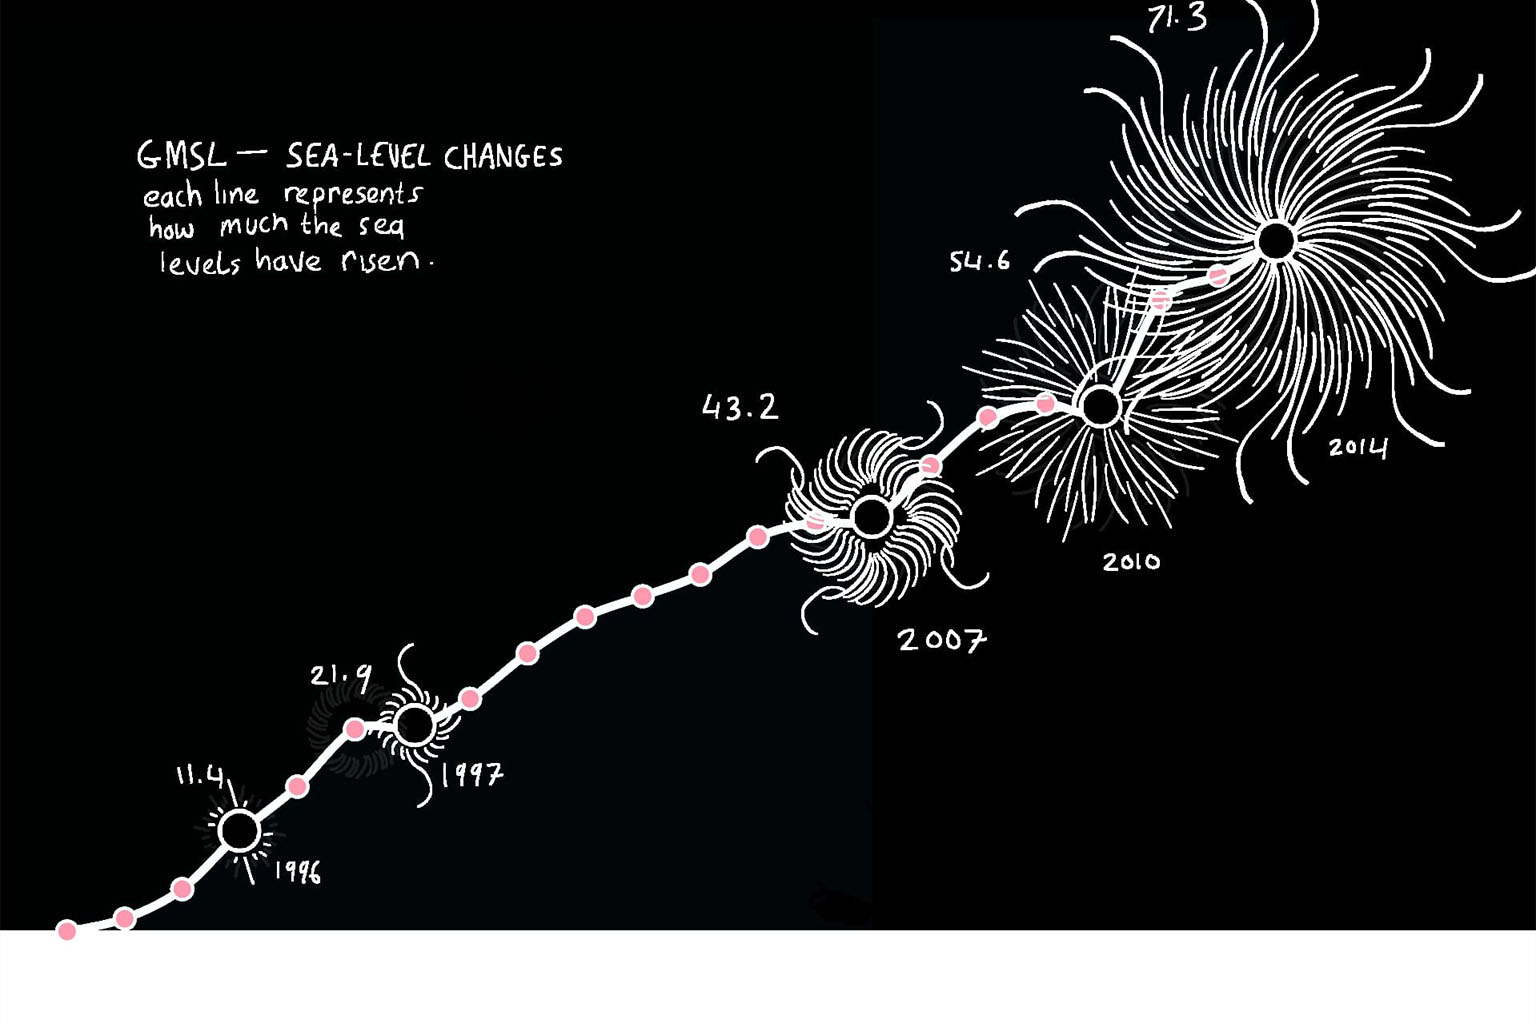
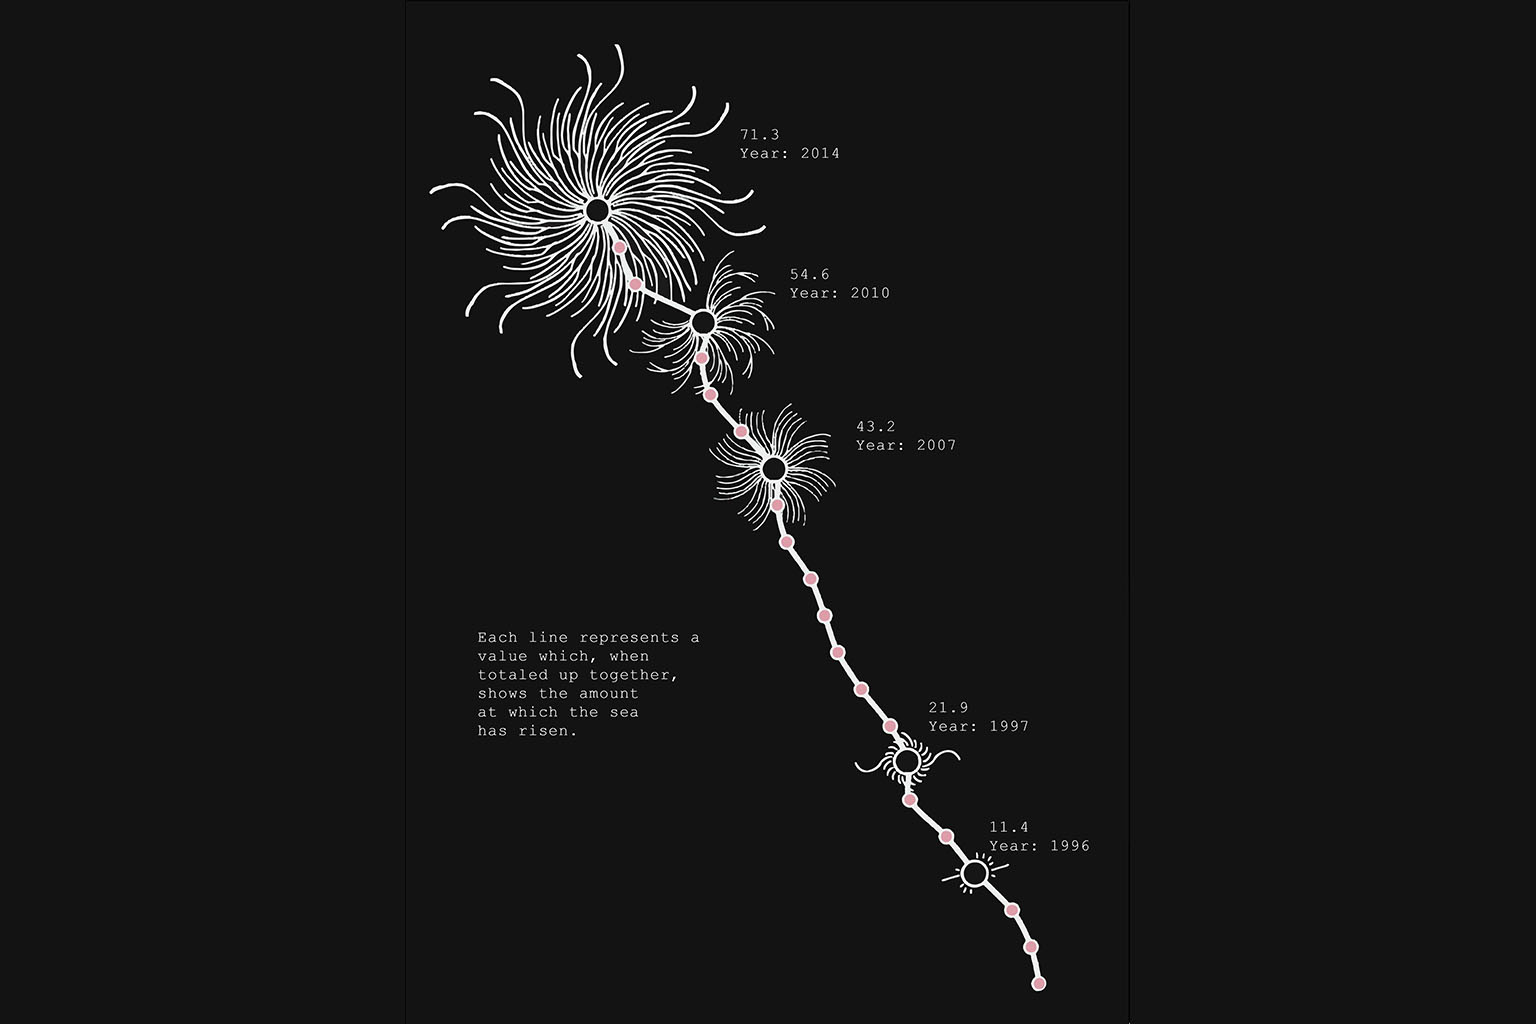
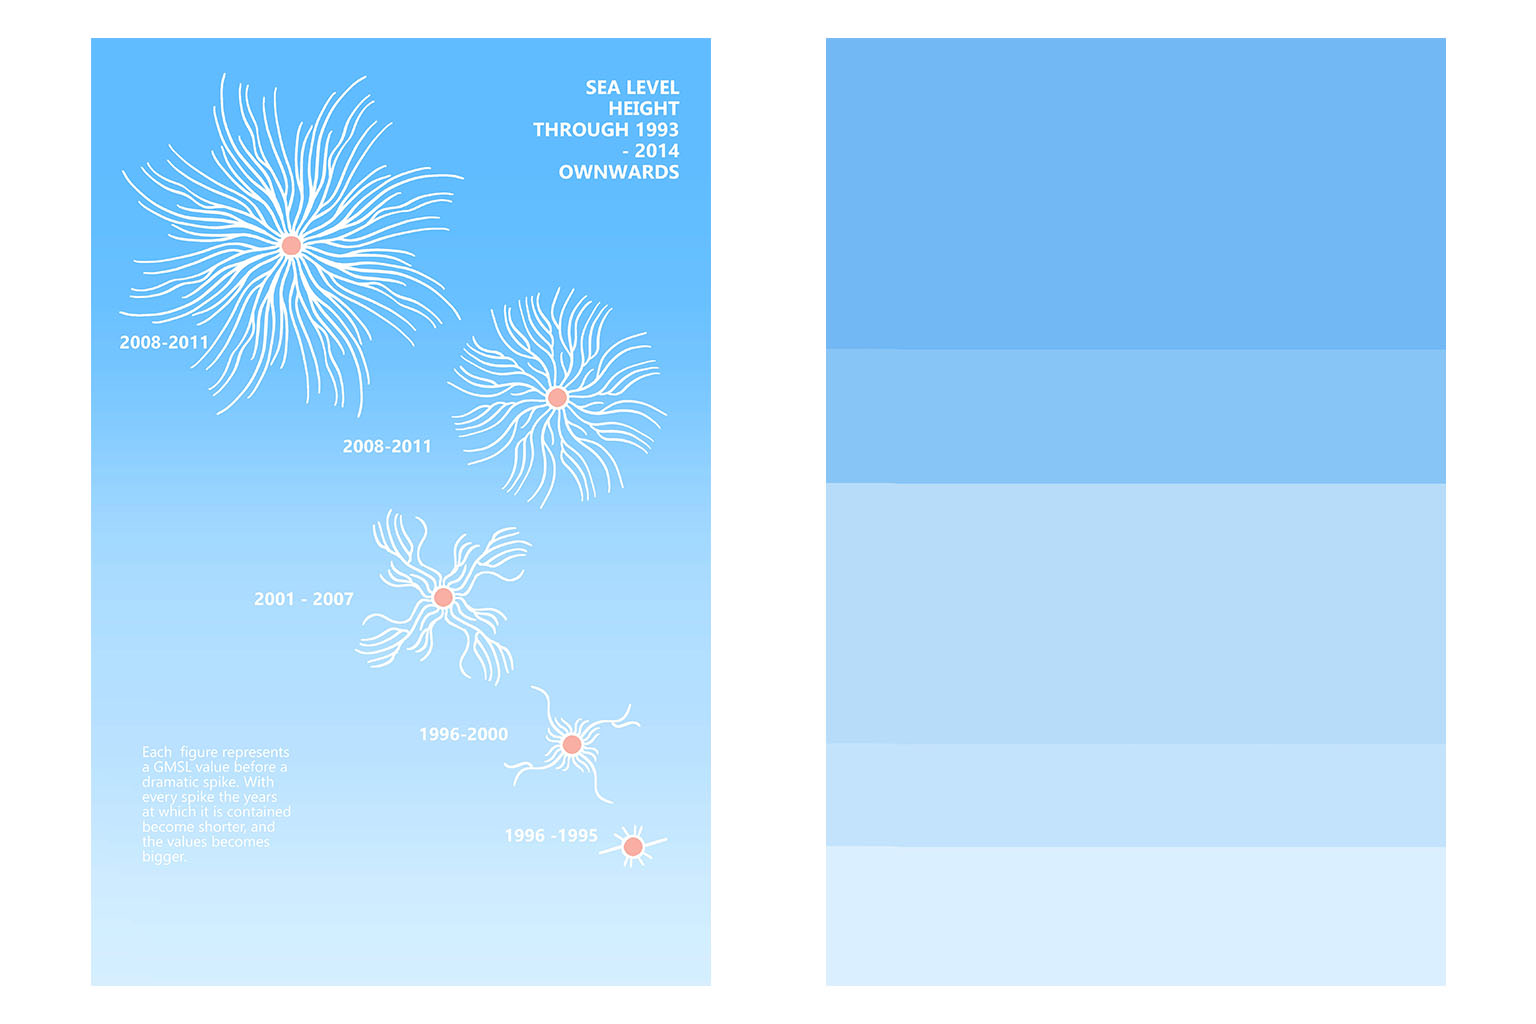
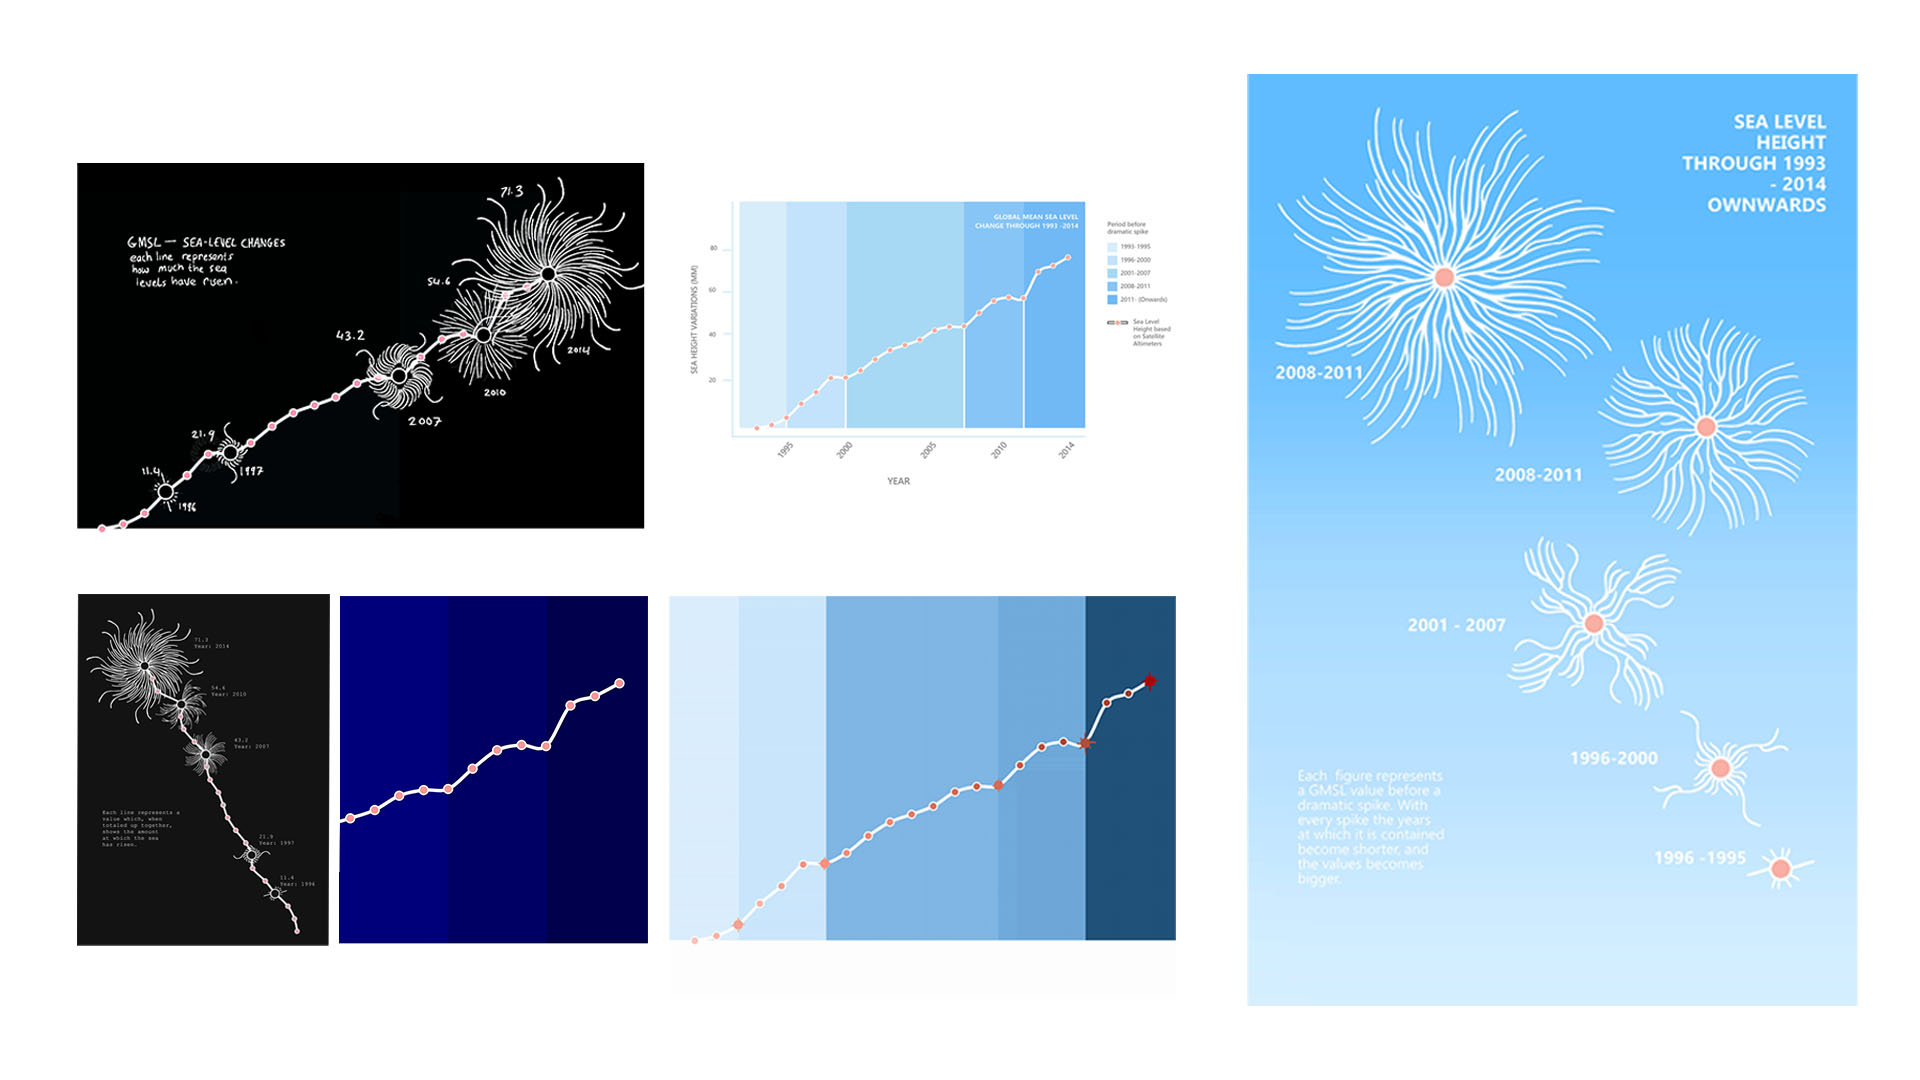
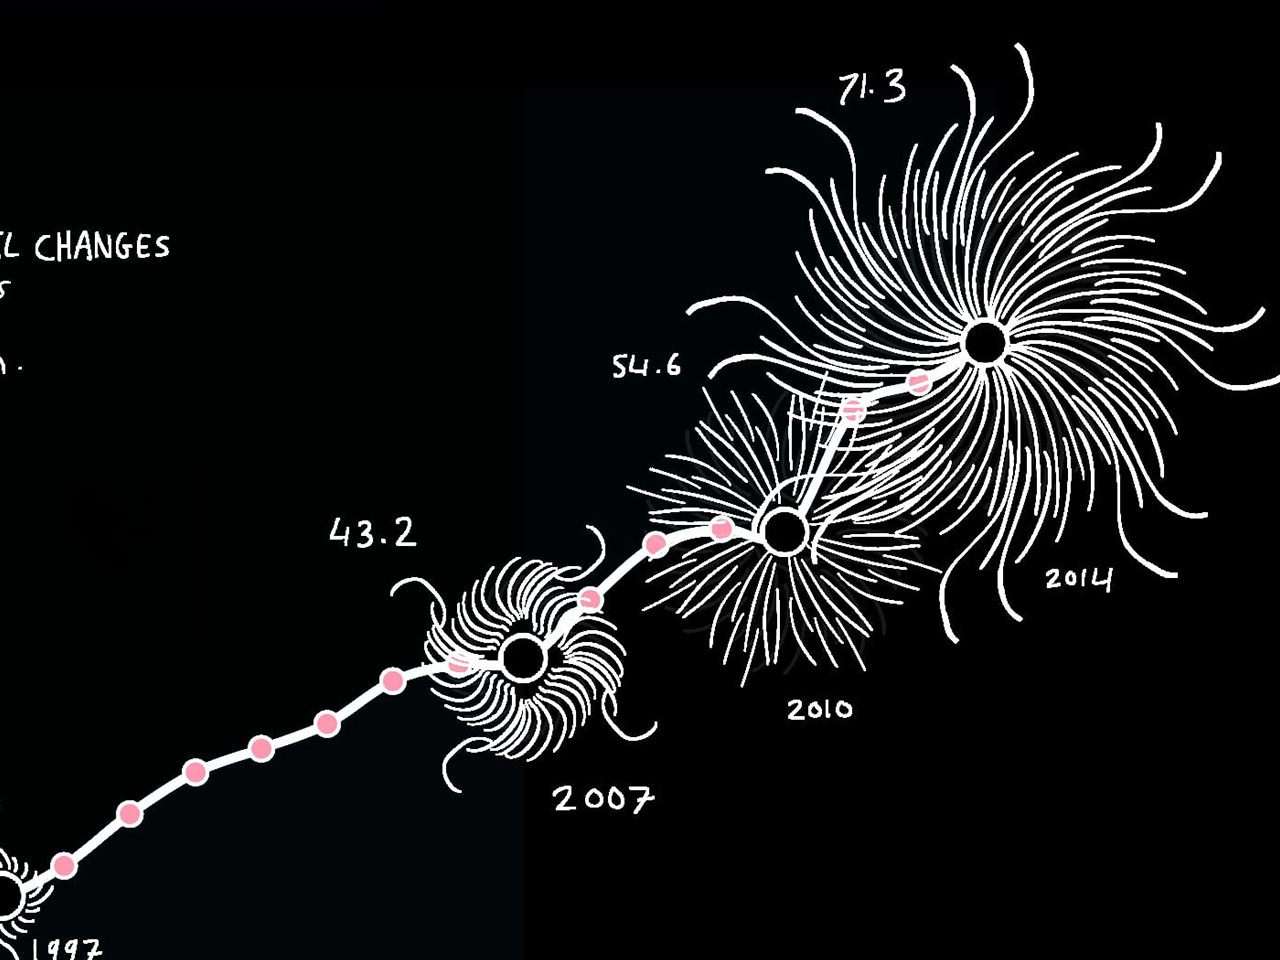
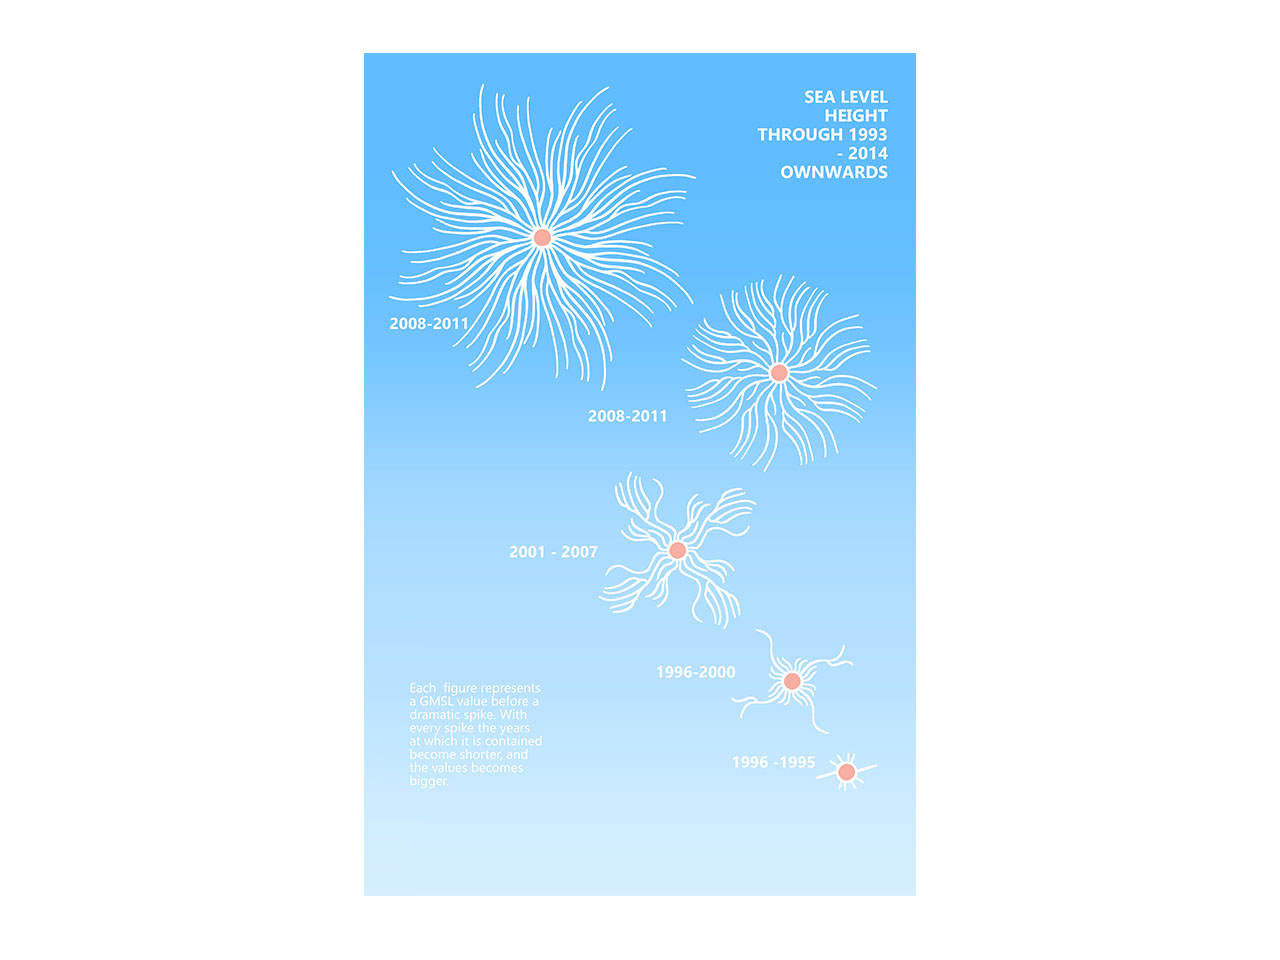
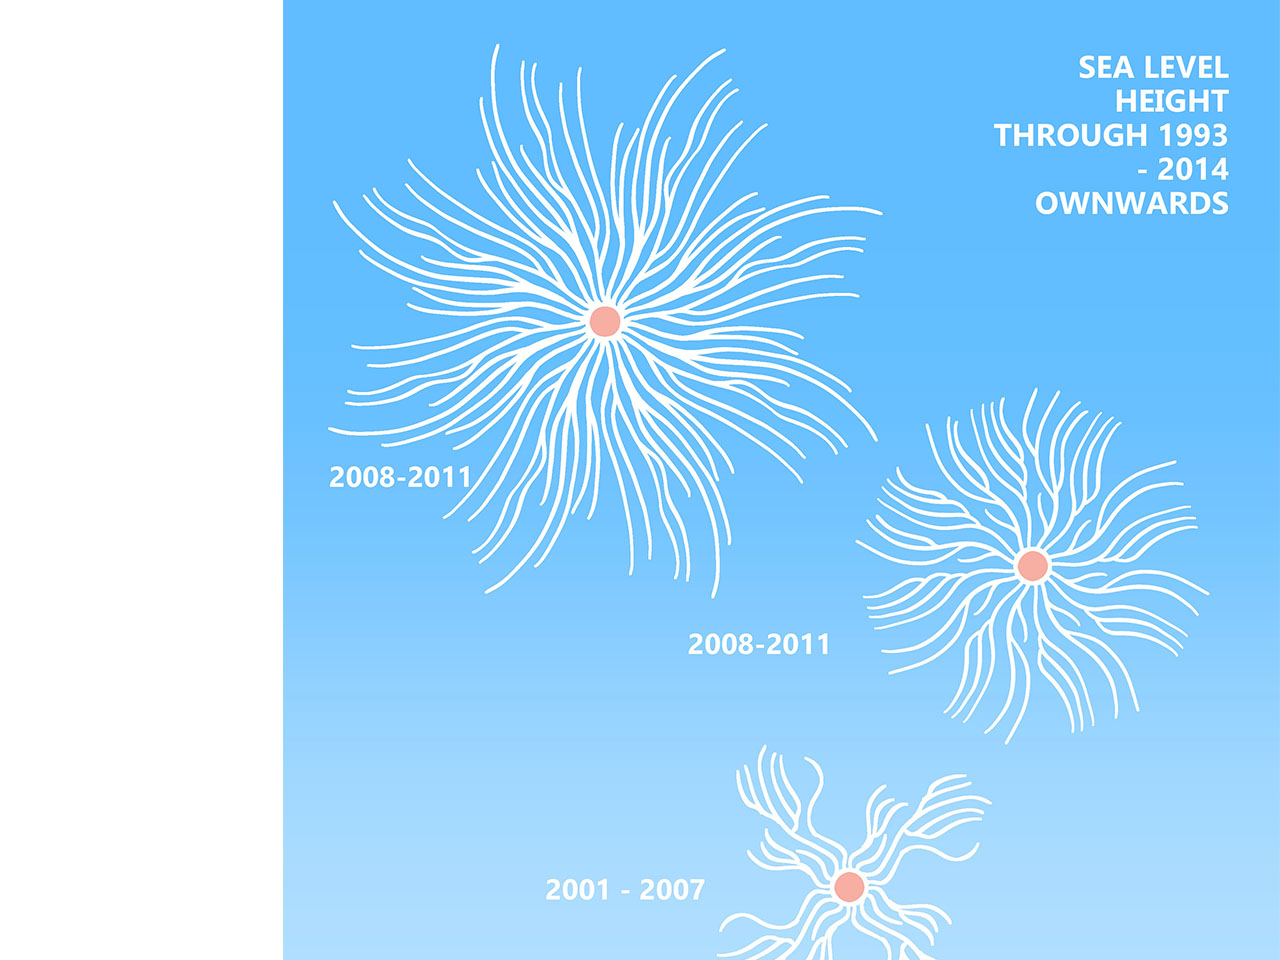
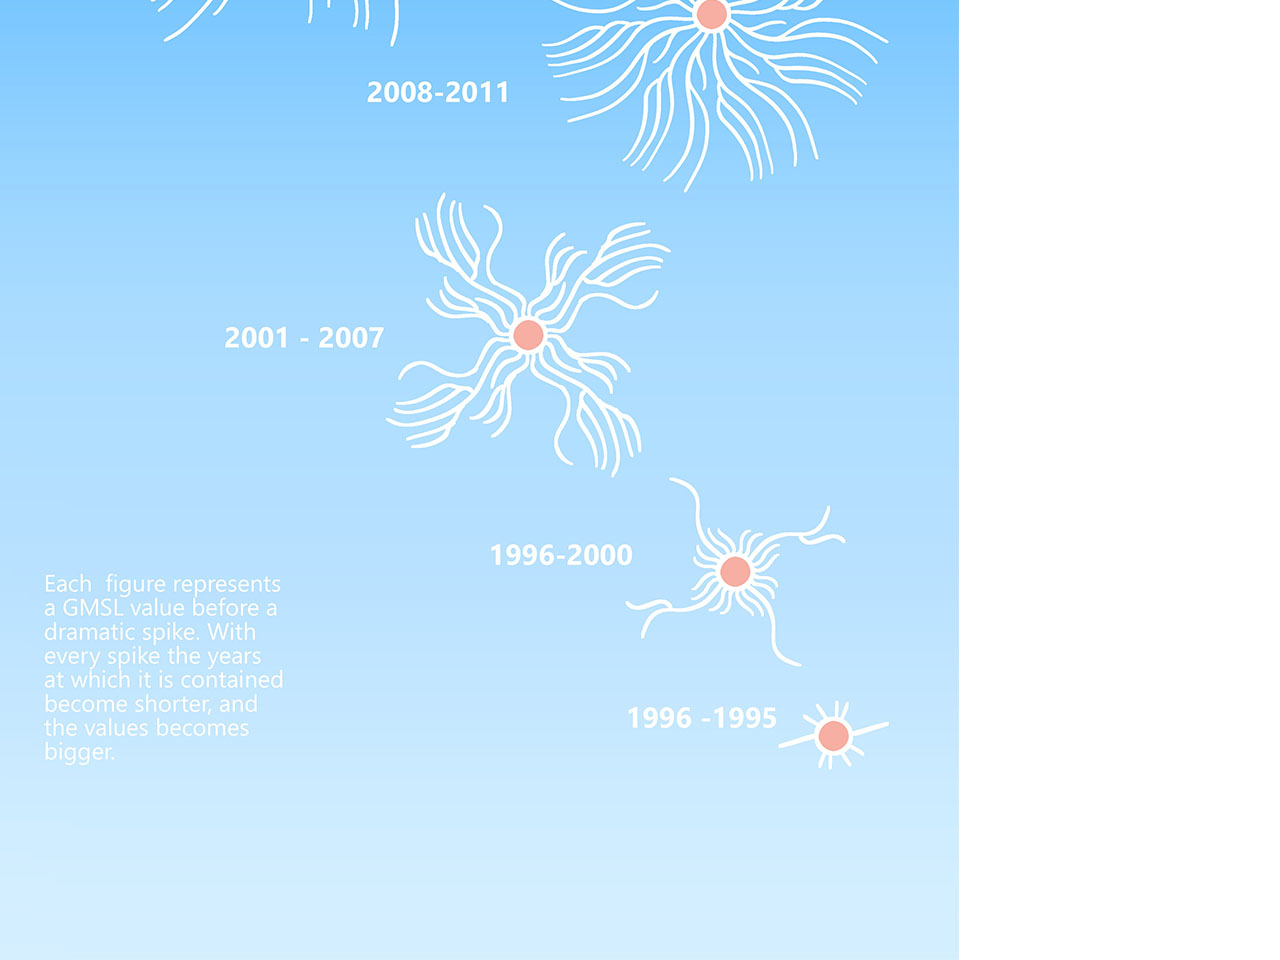
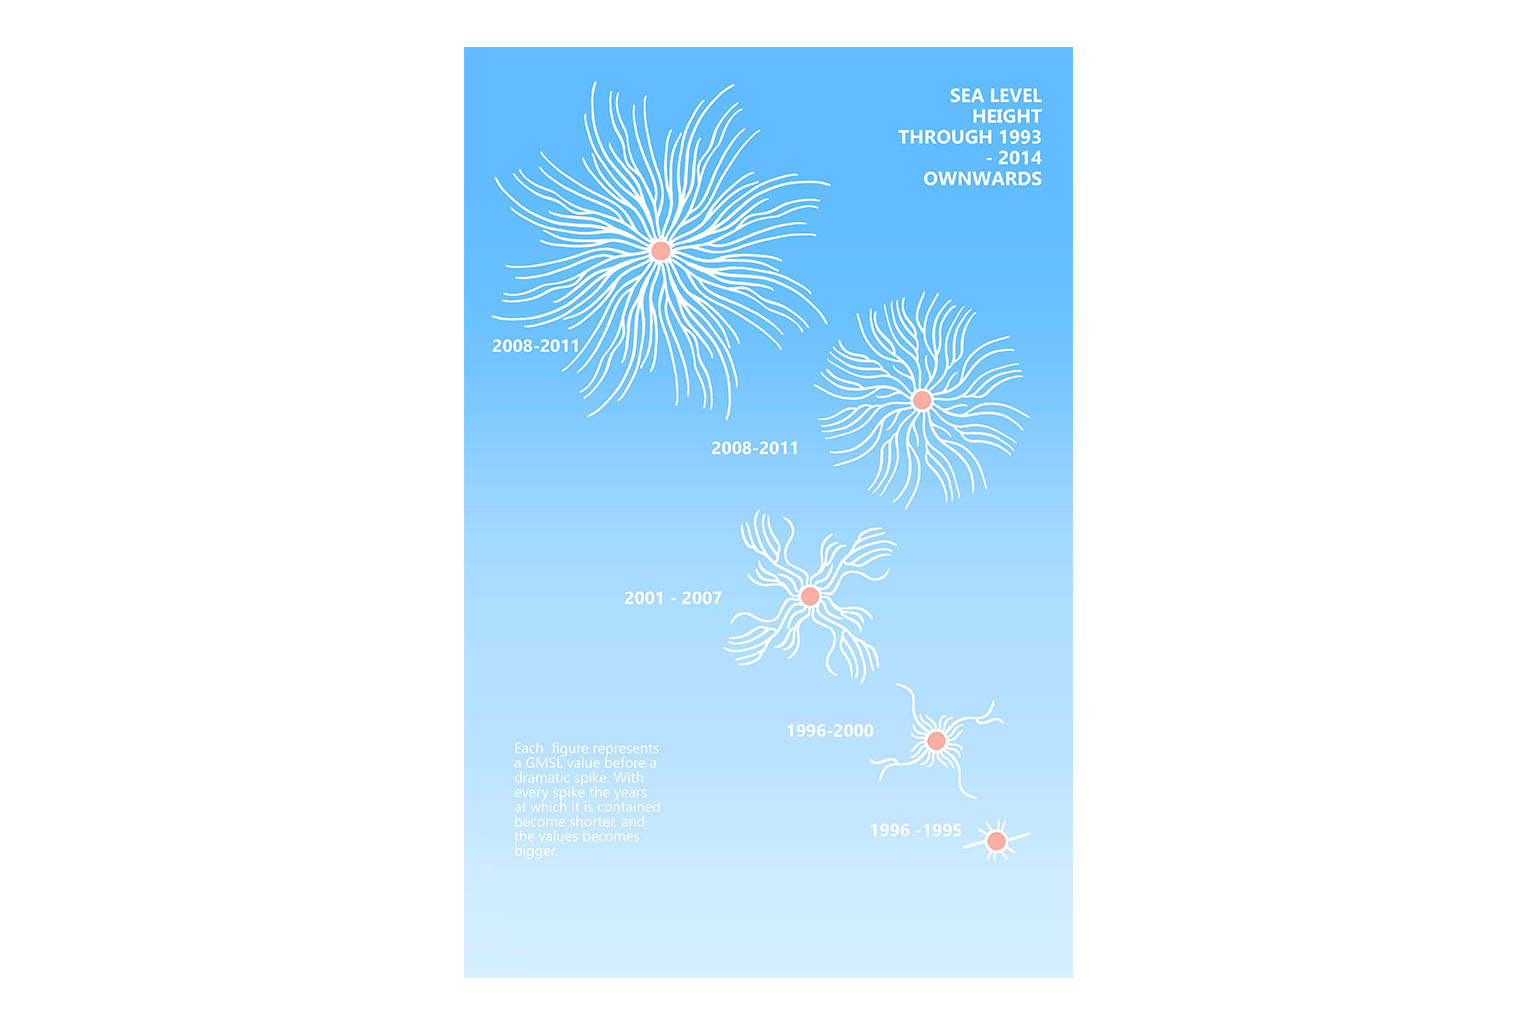
An illustration that showcases the various levels that the ocean reached in specific periods of time. Each “anemone” contains a specific value where the ocean sea level was “stable” before a dramatic change within its dataset. As we can see, the sea level dramatically increased as the years went on, most likely due to climate change. .
Description
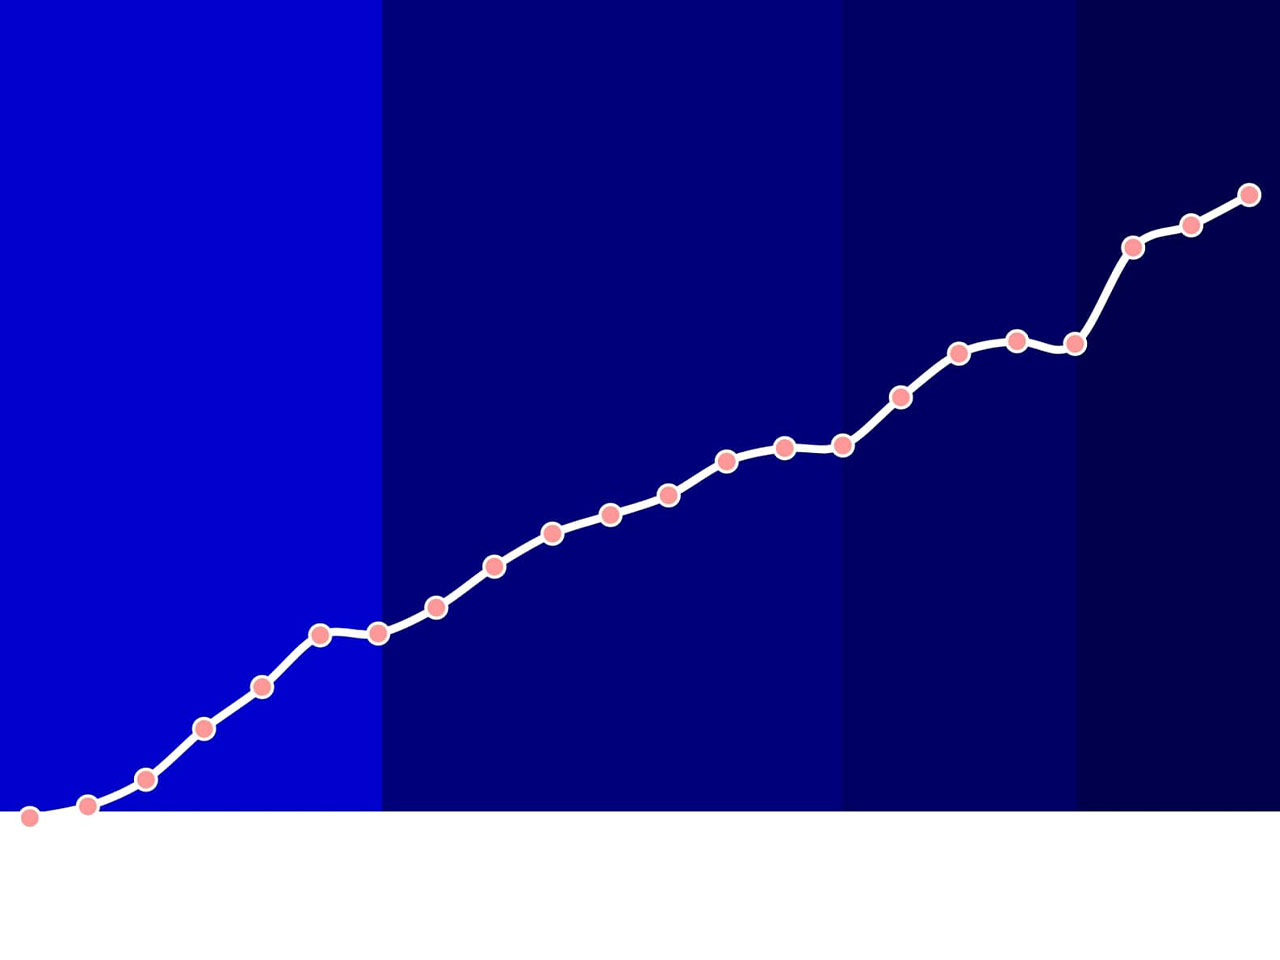
The artefact, as mentioned previously, is an illustration that depicts various GMSL levels that the ocean went through throughout certain periods of time. Each GMSL period is represented by an anemone which is differentiated by when the GMSL had a dramatic change (in value). It’s relation to the data visualization is that it further depicts the disparity between previous and later years’ GMSL through a similar means of representation. In that it depicts periods of time as anemones that can be isolated and compared to with the other (giving a more specific idea of what that particular year was like for the ocean)
