Data
"The ocean is rising at a rapid rate, and one can point at climate change to be a culprit"

Introduction
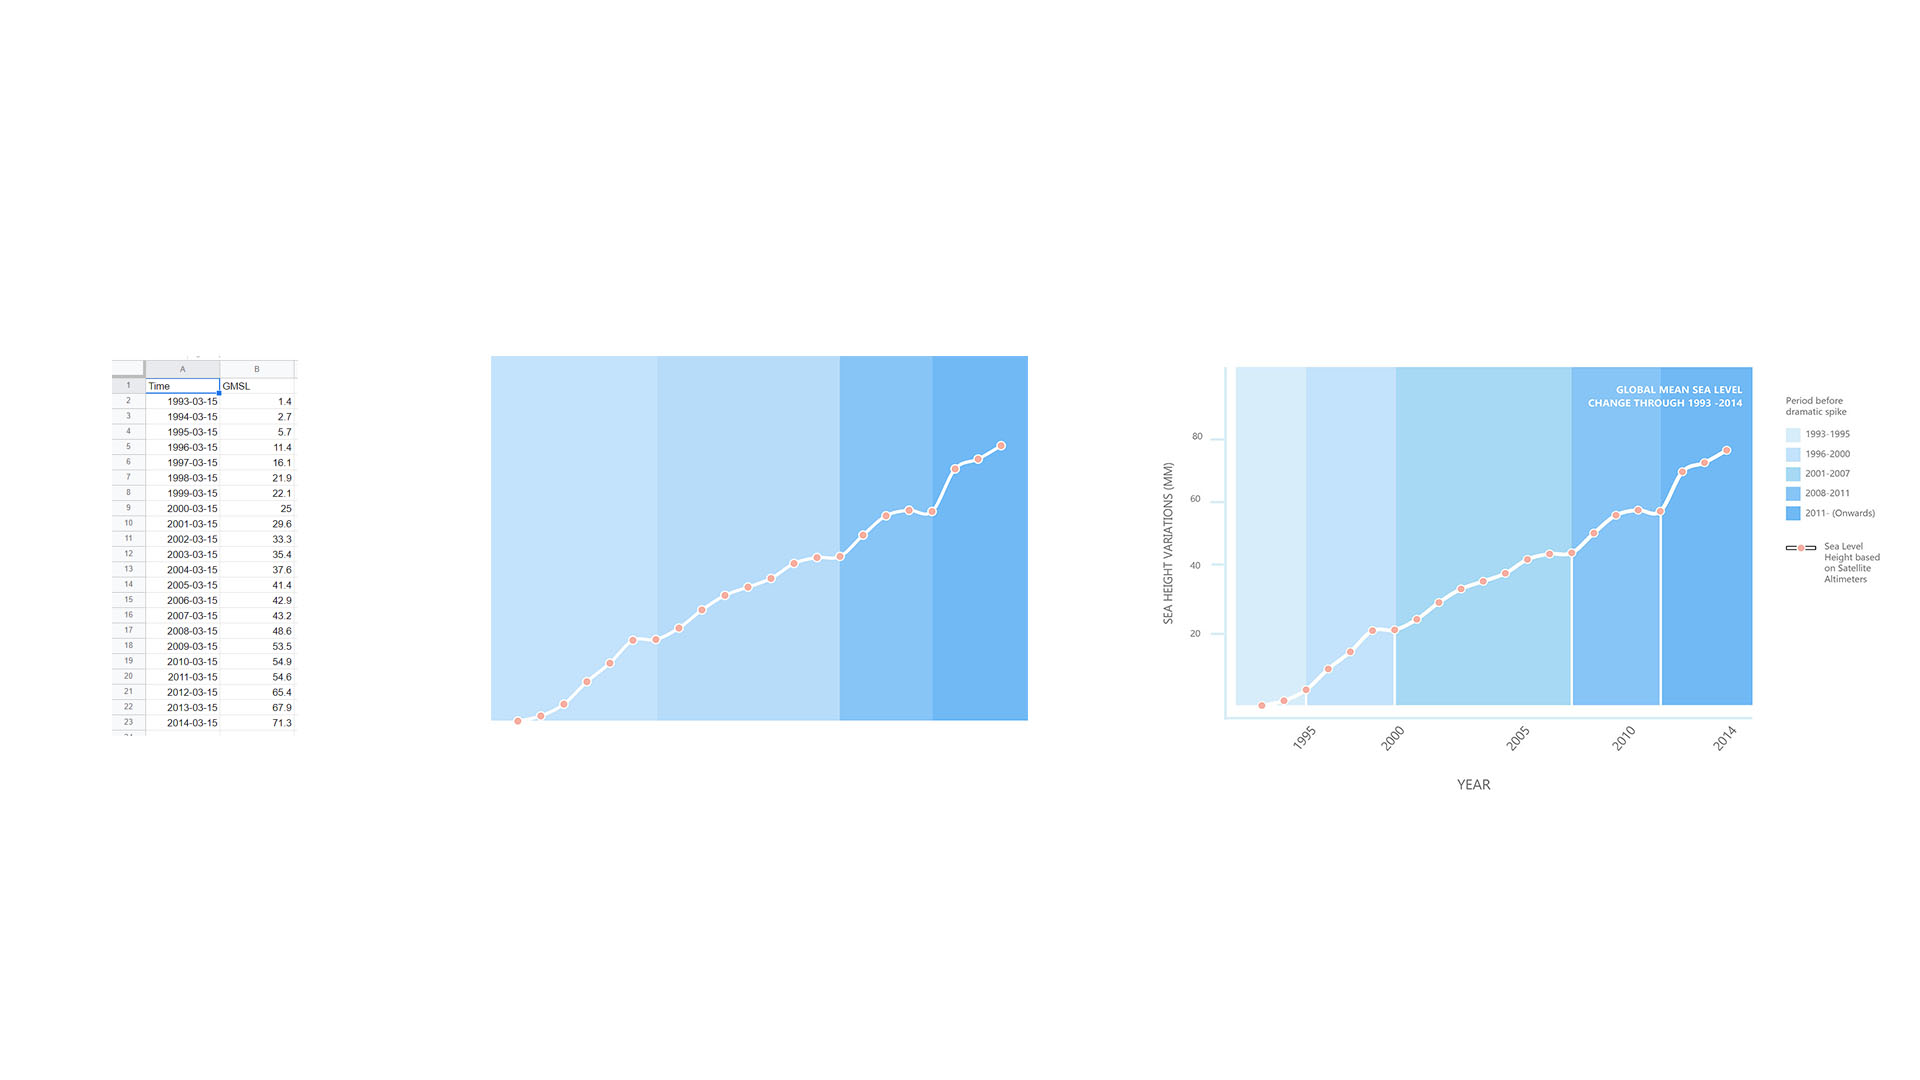
GMSL is a term used to describe the changes of sea level on an average.It is essentially an area-weighted mean of all the sea surface height anomalies, measured by “an altimeter in a single, 10-day satellite track repeat cycle” by satellite Jason-3. Another way of thinking of GMSL is by calling it “eustatic sea level”. The eustatic sea level is essentially a representation of all the world's water in the ocean if it were contained in a single basin. Changes to this are caused by things such as the total water mass, changes in the size of the ocean basin, along with the density changes of the water also known as thermal expansion. In relation to this, the GMSL of our ocean has risen about 8-9 inches through the last two decades. This rise in sea level can be attributed to a variety of factors, though it has been pinpointed to a combination of melt-water from glaciers and ice-sheets from greenland and the arctic. In 2020 alone the global mean sea level had risen 91.3mm above the 1993 average making it the highest annual average on record.
Data Visualisation
The data visualization that I have applied is that of a line graph. Since the dataset that I am using follows a range a time that is chronological, I figured that using a line graph, which is best used when discussing a range of time and changes within that range, would be the most appropriate and if not the most effective method of data visualization for this dataset. Furthermore, I tried to specify the dataset by color coding the periods at which, in my case, the ocean showed steady rising before a dramatic spike within its value. This functions as a sort of narrative for the audience to understand when it comes to sea level rising.
Findings
The most obvious finding is that the GMSL is rapidly increasing likely because of climate change. There are also periods where the GMSL was stable, however those stable periods became shorter and shorter as the years went on with dramatic jumps happening more often than before.
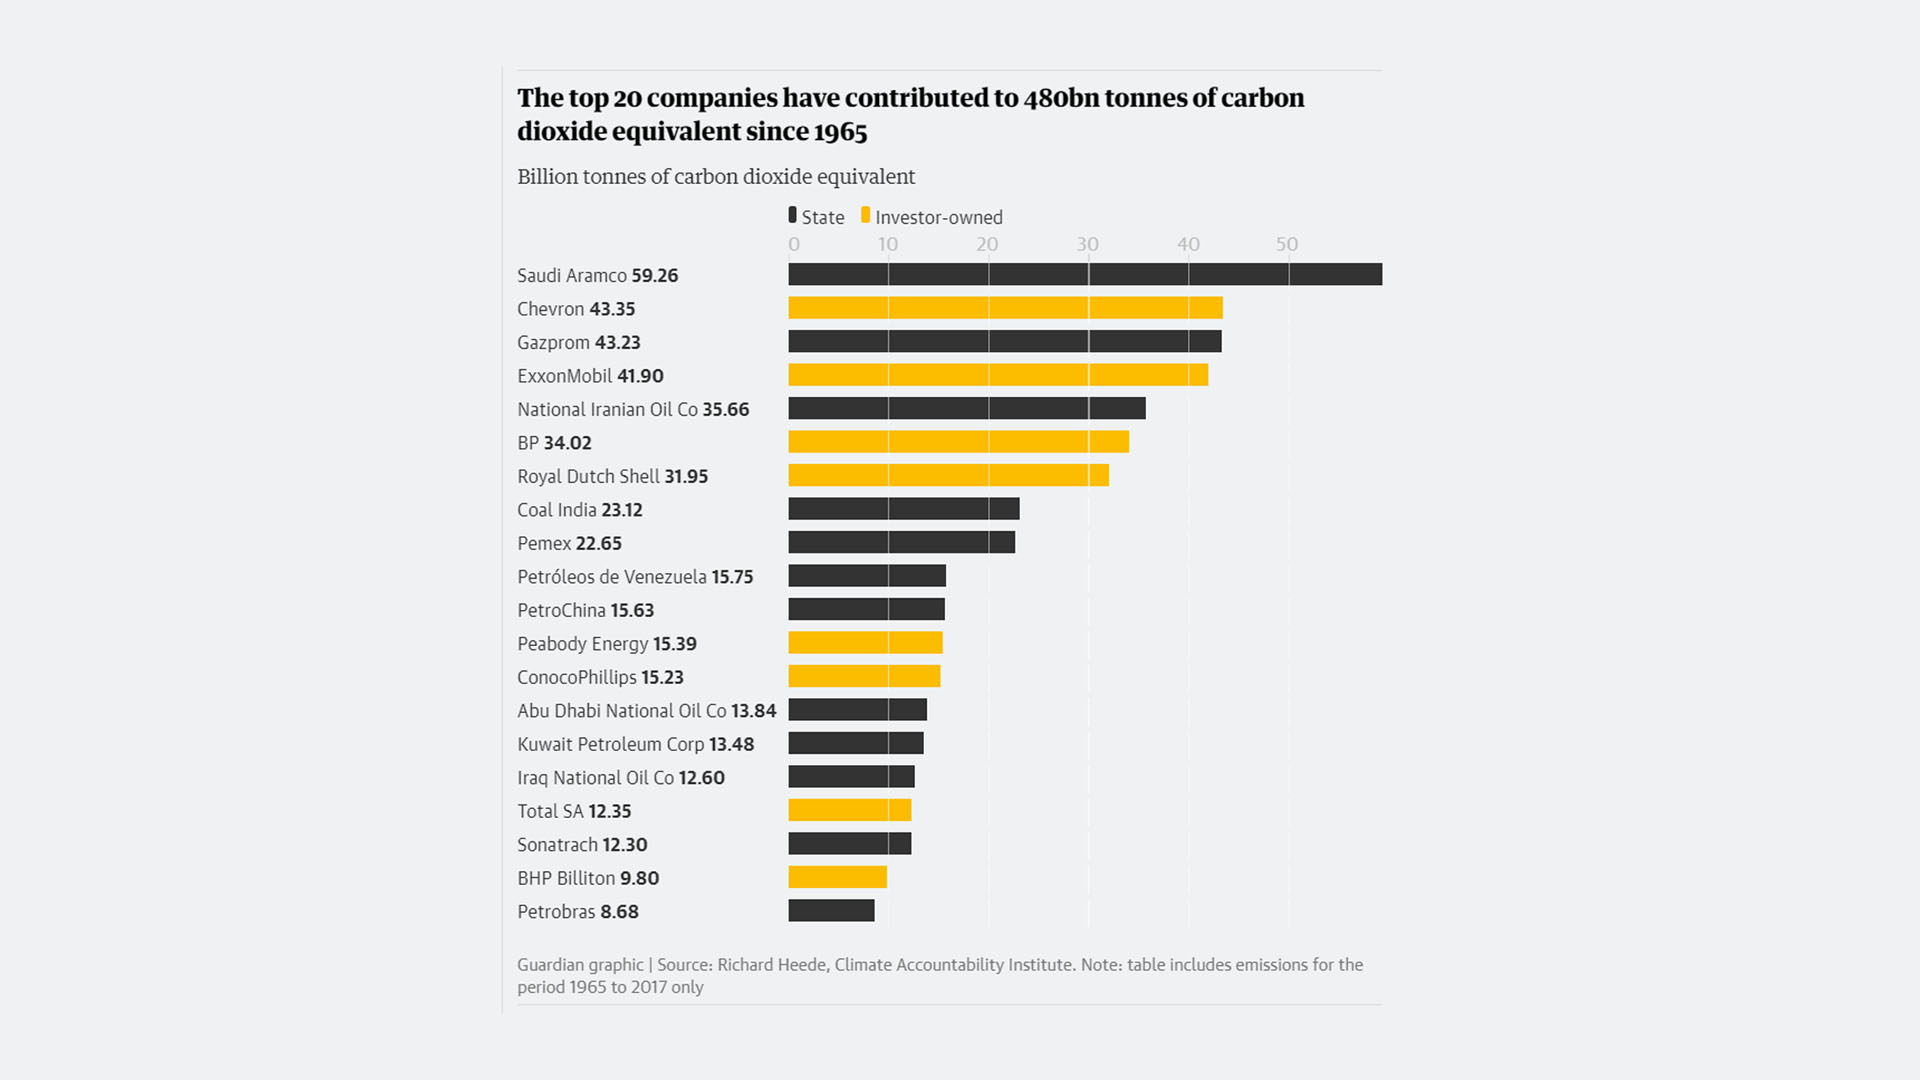
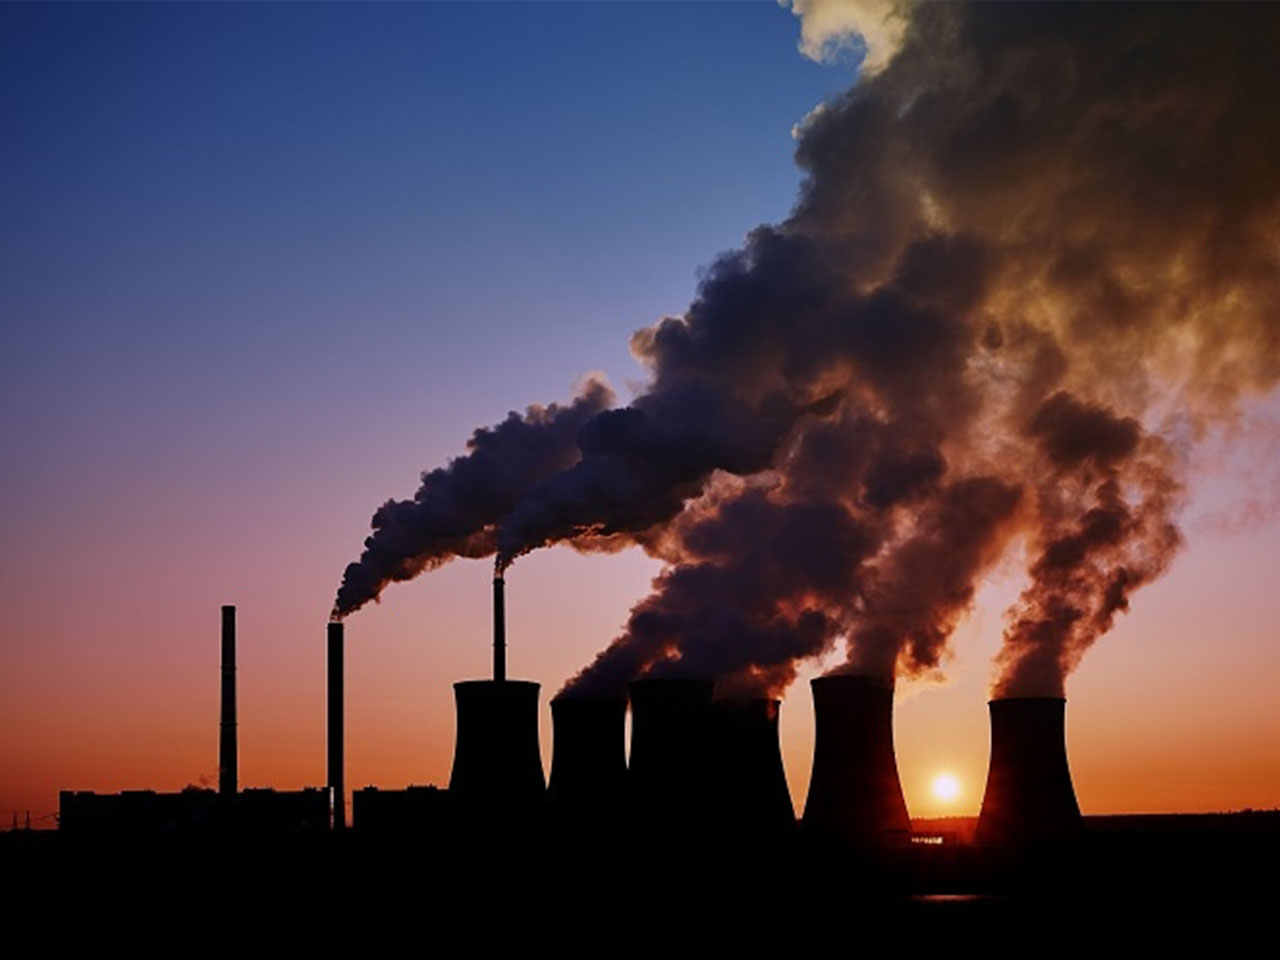
Many of these jumps can be attributed to a variety of reasons associated with human activities. But a particular reason that is often said to be one of the biggest culprits is the burning of fossil fuel. The graph above shows various companies who contribute to this despite the warnings scientists and researchers have shown if continued. This constant use of fossil fuel for human activity has generated a total of 480bn tonnes of carbon dioxide worldwide since 1965. And for that reason, temperatures have risen considerably causing many of the aforementioned effects to occur (such as the melting of glaciers, thermal expansion, and changes in the earth’s basin)
Insights
Aside from the previously mentioned, what can be understood is that the data and the increase of GMSL works and relates with the carbon emission levels through the years, as with carbon emission comes a rise in temperature. This works in conjunction with glaciers melting along with the expansion of sea water due to the temperature changes in our atmosphere.
Furthermore, periods at which the GMSL rose are significantly becoming shorter, most likely due to the sharp increase in climate caused partially by human activities that use make use of fossil fuels.

Conclusion
It can be concluded that the increase of climate change is tied to the general mean sea level changes. With the temperature rising caused by current human activities, things like glaciers begin to melt along with an array of other elements that have a hand in the rise of sea level. Furthermore, as climate change begins to take hold, the periods at which the sea level is increasing becomes a lot more rapid and sharp with 2011 to 2014 being the quickest it has increased thus far. In addition to that, the rapid increase in sea levels would most likely cause changes in the way people live and where people live, especially coastal and island nations where sea level would affect them the most.
References
- Lindsey, Rebecca. "Climate Change: Global Sea Level.", NOAA Climate.gov | Science & Information for a Climate-smart Nation, . www.climate.gov/news-features/understanding-climate/climate-change-global-sea-level.
- Nunez, Christina. "Sea Level Rise, Facts and Information." National Geographic,. 19 Feb. 2019, www.nationalgeographic.com/environment/article/sea-level-rise-1.
- Nerem, R. S. "What is the Definition of Global Mean Sea Level (GMSL) and Its Rate?" Sea Level Research Group, . sealevel.colorado.edu/presentation/what-definition-global-mean-sea-level-gmsl-and-its-rate.
- Griggs, Gary. "Explainer: How Do You Measure a Sea's Level, Anyway?" The ConversationThe Conversation. theconversation.com/explainer-how-do-you-measure-a-seas-level-anyway-41420..
- "Key Indicators: Global Mean Sea Level." NASA Sea Level Change Portal, .sealevel.nasa.gov/understanding-sea-level/key-indicators/global-mean-sea-level/.
- Taylor, Matthew, and Jonathan Watts. "Revealed: the 20 Firms Behind a Third of All Carbon Emissions." The Guardian,.28 Sept. 2020, www.theguardian.com/environment/2019/oct/09/revealed-20-firms-third-carbon-emissions.
